![]()
![]()
![]()
![]()
You can create Instant Reports using the Instant Report icon.
To create an Instant Report:
Select Reports > Select the Module > Instant Report icon ![]() . The following page is displayed.
. The following page is displayed.
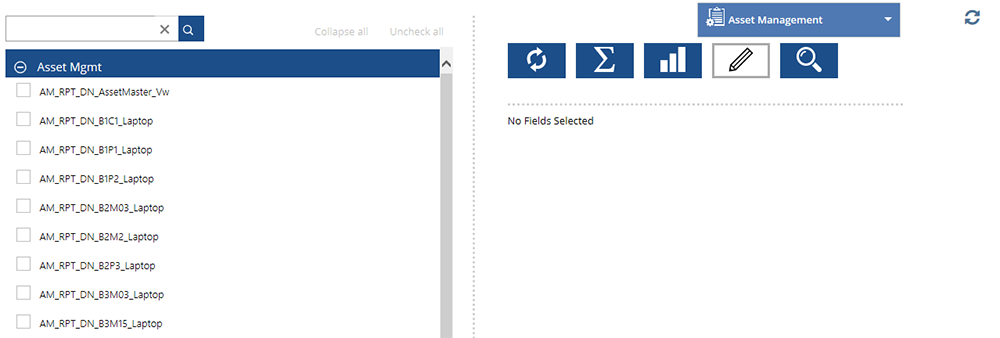
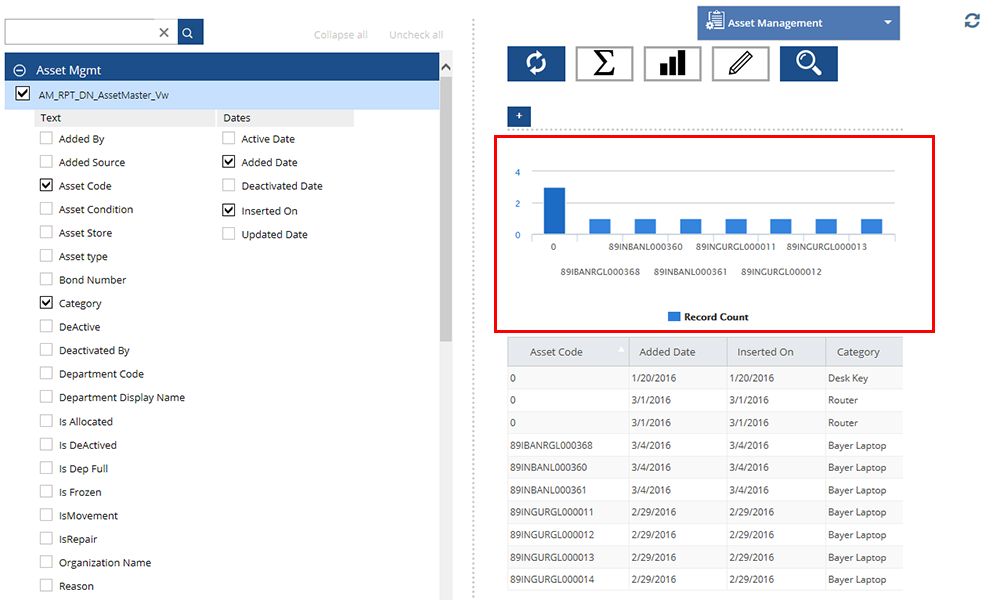
On the left side of the Instant Report page, select the check box of the data source for which you want to create report, and then select the appropriate fields under the category. A preview of the report is displayed on the right side of the Instant Report page. For more information about the fields on the Instant Report page, see Field description.
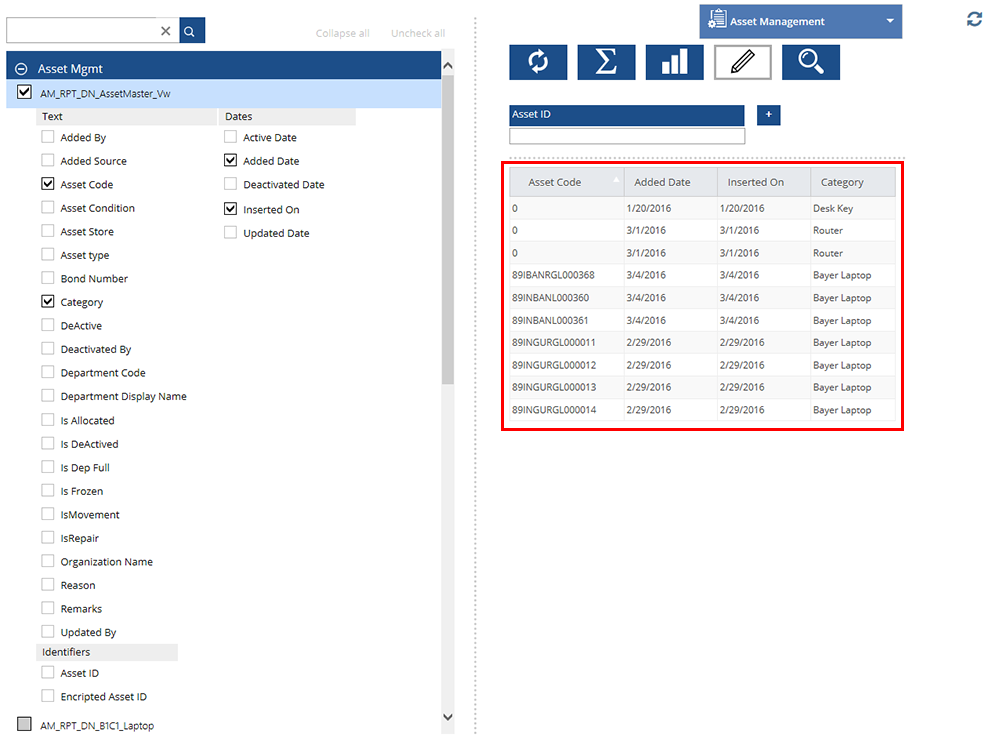
Figure: Instant Report page
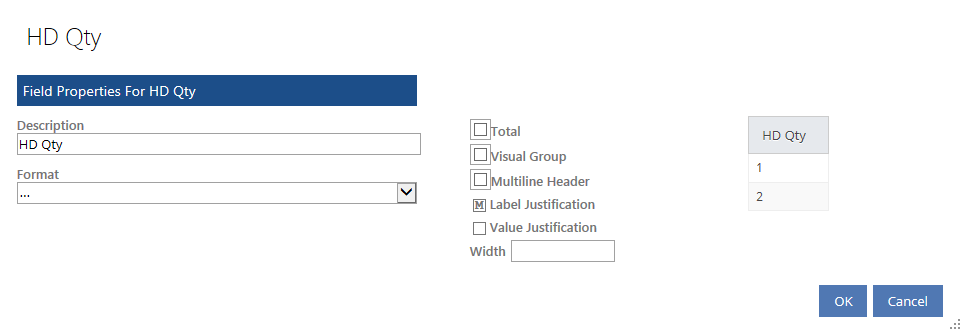
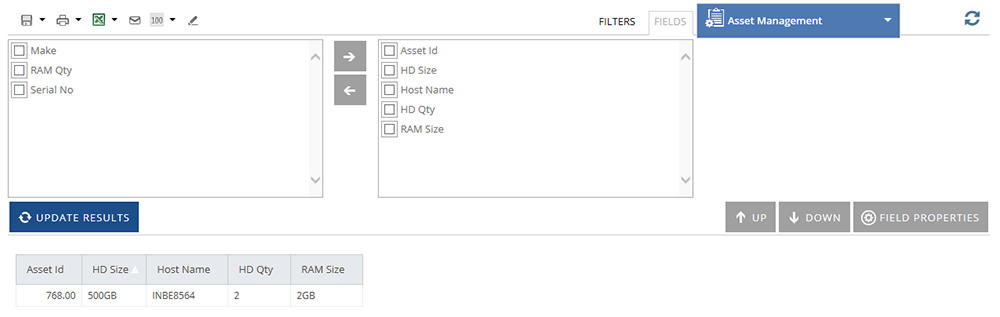
Note: To view the field properties for each field,  See Screen Shot. To reorder the fields in the report preview, select the field header that you want to reorder and drag to the position you want. See Screen Shot. To reorder the fields in the report preview, select the field header that you want to reorder and drag to the position you want.
|
| Field | Description |
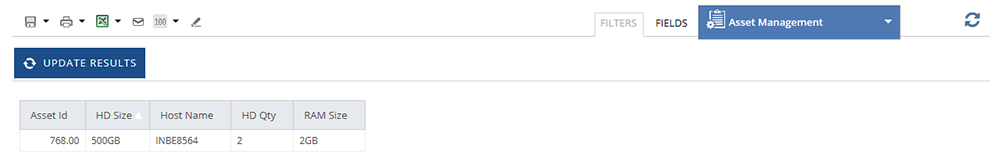
| Click the Update Preview icon to update the preview after you apply additional filters. | |
 |
Click the Add Subtotals icon to view a subtotal value under each numeric column. |
| Click the Design Report icon to design the report with the data sources selected by you. See Fields. | |
| Click the Add Chart icon to add a graphical chart of the report. See Screen Shot.
|
|
| Click the View Report icon to view the report that you created. See Screen Shot.
|
|
| Search Box | Enables you to search for a data source or field. |
| Collapse all | Click to collapse the expanded data sources. |
| Uncheck all | Click to deselect all the selected data sources. |