![]()

![]()
On the SCRIPT BASED MONITORING page, you can map parameter and device type to selected scripts name,arguments name. You can configure the display area and group name to display the monitored values for the configured parameter. The scripts are executed for the selected device type at the configured intervals on the CUSTOM SCHEDULER (SCRIPT/ SNMP) page.
To map Scripts Monitoring details:
Select Admin > Advanced > Discovery & Monitoring > Scripts.
On the SCRIPT BASED MONITORING page,click the ADD NEW icon on the ACTIONS panel.
On the SCRIPT BASED MONITORING page, specify the required details. For more information about the fields on the SCRIPT BASED MONITORING page see, Field Description.
Click SUBMIT.

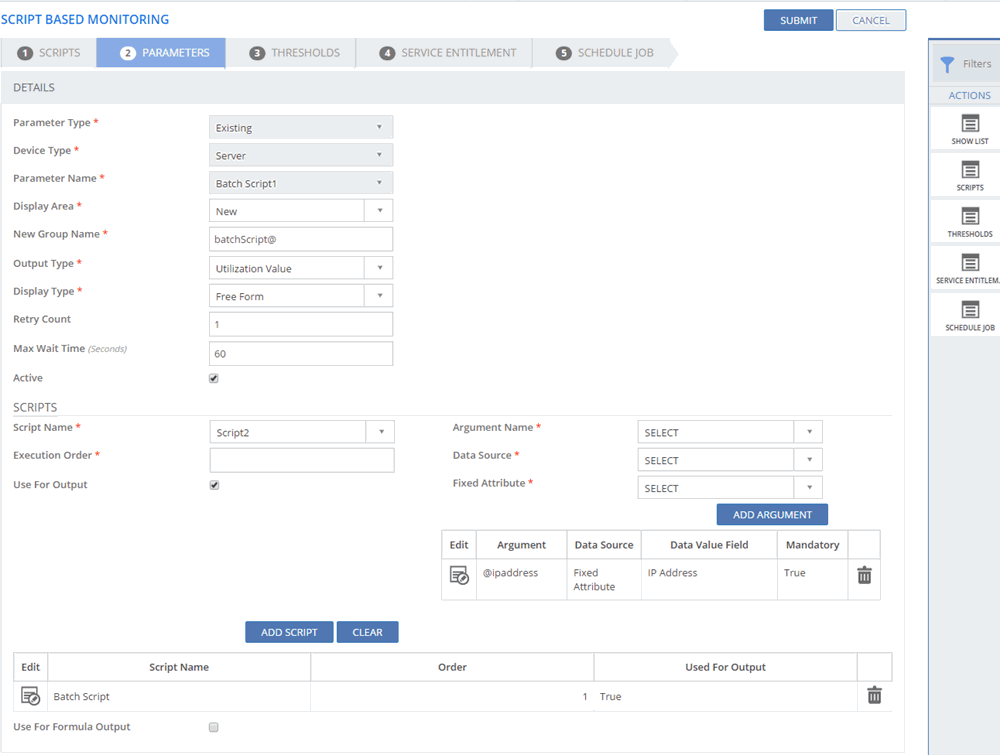
Figure: SCRIPT BASED MONITORING page
The following table describes the fields on the SCRIPT BASED MONITORING page.
| Fields | Description |
| Parameter Type | Select the Parameter Type from the list:
|
| Device Type | Lists the Device Types such as Networks, Servers,and so on. Select the Device Type from the list. |
| Parameter Name |
The Parameter Name is displayed as drop-down list, if the Parameter Type is selected as Existing. The existing parameters are listed in the drop-down. Select a Parameter Name from the list. The Parameter Name is displayed as Text box,if the Parameter Type is selected as New. Enter the Parameter Name. |
| Display Area | Select the display area from the list:
|
| Group Name | Lists the existing tabs for the selected Entity Type. Select the group name from the list to display the parameters. This field is displayed if the Display Area is selected as Existing. |
| New Group Name | Type in the group name for the new tab. This field is displayed if the Display Area is selected as New. |
| Output Type | Select the output type from the list:
|
| Display Type | Select the display type from the list:
Note: The Display Type is displayed if the Output Type is selected as Utilization Percentage or Utilization Value. |
| Retry Count | Specify the count to execute the Script again, if the execution of the Script fails. |
| Max Wait Time (Seconds) | Specify the maximum waiting time for the output. |
| Active |
Indicates the status for the configuration of Script based Monitoring.
|
| SCRIPTS | |
| Script Name | Lists the configured Script names. Select a Script name from the list. |
| Argument Name | Lists the configured argument names. |
| Execution Order | Specify the execution order for the Script. |
| Data Source | Select the Data Source for the parameter:
|
| Fixed Attribute | If the Data Source is selected as Fixed Attribute, the Fixed Attribute field is displayed. Select the Fixed Attribute Field from the list. |
| Fixed Input | If the Data Source is selected as Fixed Input, the Fixed Input is displayed. Type in the Fixed input for the parameter. |
| Use For Output | Select the check box to use the parsed value for output. |
| Add Argument | Click the button to add the selected arguments for monitoring. |
| Add Scripts | Click the button to add the selected scripts for monitoring. |
| Clear | Click the button to reset the selected Script details. |
| Edit | Click the Edit button to edit the selected script details. |
| Script Name | Displays the configured Script Name. |
| Order | Displays the configured order. |
| Used for Output | Displays if the parsed value is used for output. |
| Delete | Click the icon to delete the configured script. |
| Use For Formula Output | Select the check box to use Formula method to get the output. |
| Output Formula | |
| Script List | Displays the list of configured scripts. Select the script, you want to add to the formula. |
| Delimiter List | Displays the list of Delimiters such as @ Current time, @ Previous Count, @ Previous Time, and so on. Select the delimiter which you want to add to the formula. The values of the delimiters are auto-calculated. |
| Write Formula |
Enter the components of the formula by selecting the delimiters, and defined keys for the formula. Type in the arithmetic symbols for the formula. |
This section explains all the icons displayed on the ACTIONS panel of the SCRIPT BASED MONITORING page:
Filters
Click the Filters icon to specify a particular filter criteria to display the configured Scripts details. On clicking the Filters icon, Select the Instance from the list to view the configurations for the selected Instance.

Figure: FILTERS pop-up
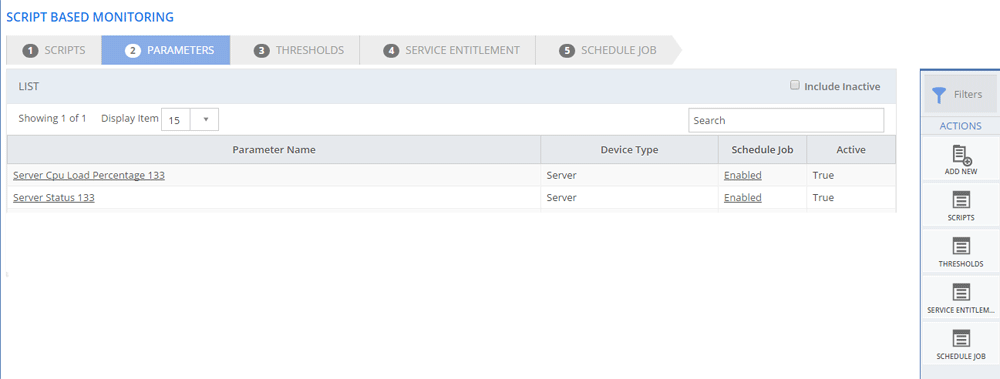
Click SHOW LIST to display the LIST table showing all the configured scripts for monitoring for the selected filter criteria.

Figure: SCRIPTS MAPPING: SHOW LIST page
| Note: When the configured Scripts based Monitoring are displayed under the LIST table, the ADD NEW action is displayed on the ACTIONS panel. Click ADD NEW to configure a new Automated Scripts Mapping. |
SCRIPTS
Click the SCRIPTS icon to configure scripts to add parameters for monitoring. On clicking the SCRIPTS icon, the SCRIPTS page is displayed. For more information about configuring scripts see, Configuring Scripts .
THRESHOLD
Click the THRESHOLD icon to configure the threshold values for the parameter. On clicking the THRESHOLD icon, the CONFIGURE SCRIPT/SNMP THRESHOLD page is displayed. For more information about configuring Script/SNMP threshold see Availability Management Online Help.
SCHEDULE JOB
Click the SCHEDULE JOB icon to configure custom scheduler details for a Script. On clicking the SCHEDULE JOB icon, the CUSTOM SCHEDULER SCRIPT/SNMP page is displayed. For more information about configuring Custom Scheduler (Script) see, Availability Management Online Help.
SERVICE ENTITLEMENT
Click the SERVICE ENTITLEMENT icon to add parameters for monitoring. On clicking the SERVICE ENTITLEMENT icon, the SERVICE ENTITLEMENT page is displayed. For more information about configuring Service Entitlement see, Availability Management Online Help.